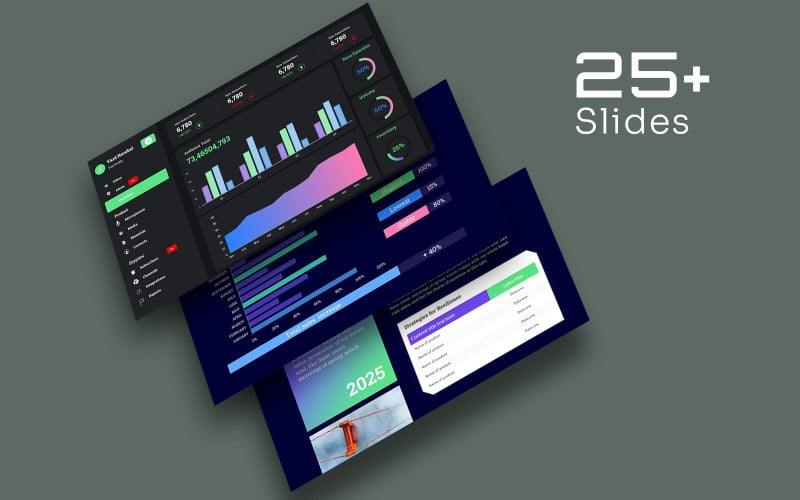
Business Table and Chart Template
Tables vs. Charts – What’s the Right Fit for Your Data?
When it comes to presenting data, it’s essential to choose the proper data visualization method for the job. So, when should you use tables, and when should you use charts? Let’s break it down.
When Should You Use Tables?
- Tables help display exact numbers and values, especially when accuracy is paramount. For example, in a research setting.
- When you must present data that requires specific formatting, such as tables of contents or product catalogs.
- When you want to provide detailed information about individual data points, such as product specifications or pricing details.
- If you need to present data that is easily searchable, such as a directory or database
- If you want to compare products.
25+ Slide Here
When Should You Use Charts?
- Use charts to display trends or patterns in your data, such as sales growth over time or website traffic fluctuations.
- Compare data across multiple categories or segments, such as market share of different product lines or revenue by region.
- Visualize complex data relationships, such as correlations between different variables or the impact of various factors on a particular metric.
- Highlight outliers or anomalies in your data, such as sudden spikes in customer complaints or significant drops in website traffic.
- Show progress towards specific goals or targets, such as using a dashboard to track KPIs or key performance indicators.
- Use charts to explain complex concepts to non-technical audiences.
0 Reviews for this product
0 Comments for this product


